This notebook is the workshop skeleton for the AI-Guided SIR Modeling Hackathon.
Dataset: Niamey, Niger measles outbreaks (biweekly case counts; communities A/B/C)
Tooling: Google Colab + Python + ChatGPT
Time unit: biweeks
Key modeling shortcut: infectious period ≈ 2 weeks ⇒ γ ≈ 1 per biweek
How to use this notebook
Each section contains: 1) A ChatGPT prompt (Markdown) you can copy into ChatGPT
2) A starter code cell (often with TODOs) to run in Colab
✅ Rule of thumb: Always request plots + sanity checks when you ask ChatGPT for help.
0. Setup
ChatGPT Prompt (copy/paste)
Persona:
You are an expert epidemiological modeler and Python educator.

Task:
- Write a Colab-ready setup cell: imports, basic plotting config, and a helper for reproducibility.
- If any package is missing show me how to run pip install

Constraints:
- Use numpy, scipy, pandas, matplotlib only

Verification:
- Print library versions and a simple "ready" message.
# =========================# Colab Setup Cell# =========================# --- If running in Colab and any package is missing, uncomment and run ---# !pip install numpy scipy pandas matplotlib# Core scientific stackimport numpy as npimport pandas as pdimport scipyfrom scipy import integrate, optimizeimport matplotlib.pyplot as plt# -------------------------# Reproducibility helper# -------------------------def set_seed(seed: int=42):""" Set random seed for reproducibility. Works for numpy-based simulations and optimization. """ np.random.seed(seed)set_seed(42)# -------------------------# Basic plotting config# -------------------------plt.rcParams.update({"figure.figsize": (8, 5),"figure.dpi": 120,"axes.grid": True,"axes.spines.top": False,"axes.spines.right": False,"axes.labelsize": 11,"axes.titlesize": 12,"legend.frameon": False,"font.size": 11,})# -------------------------# Version check# -------------------------print("Library versions:")print(f" numpy : {np.__version__}")print(f" pandas : {pd.__version__}")print(f" scipy : {scipy.__version__}")print(f" matplotlib : {plt.matplotlib.__version__}")print("\nSetup complete — ready ✅")
Persona:
You are an expert epidemiological modeler and Python educator.

Context:
- Dataset contains biweekly measles case counts from Niamey, Niger
- File path: data/niamey.csv

Task:
Write Python code to:
1. Load data/niamey.csv store it to `measles_df`
2. Display the first few rows
3. Print column names and basic information about the dataset
4. Show basic statistics about dataset

Constraints
- Use pandas only
- Keep code simple and readable
import pandas as pd# 1. Load the datasetmeasles_df = pd.read_csv("data/niamey.csv")# 2. Display the first few rowsprint("First 5 rows of the dataset:")print(measles_df.head())# 3. Print column names and basic informationprint("\nColumn names:")print(measles_df.columns.tolist())print("\nDataset information:")print(measles_df.info())# 4. Show basic statistics (numeric columns)print("\nBasic statistics:")print(measles_df.describe())# 5. Show unique values for categorical columnscategorical_columns = measles_df.select_dtypes(include=["object", "category"]).columnsiflen(categorical_columns) >0:print("\nCategorical columns and their unique values:")for col in categorical_columns:print(f"\n{col}:")print(measles_df[col].unique())else:print("\nNo categorical columns found.")
First 5 rows of the dataset:
   biweek community  measles
0       1         A     22.0
1       2         A     27.0
2       3         A     64.0
3       4         A     84.0
4       5         A    116.0

Column names:
['biweek', 'community', 'measles']

Dataset information:
<class 'pandas.core.frame.DataFrame'>
RangeIndex: 48 entries, 0 to 47
Data columns (total 3 columns):
 #   Column     Non-Null Count  Dtype
---  ------     --------------  -----
 0   biweek     48 non-null     int64
 1   community  48 non-null     object
 2   measles    47 non-null     float64
dtypes: float64(1), int64(1), object(1)
memory usage: 1.3+ KB
None

Basic statistics:
          biweek      measles
count  48.000000    47.000000
mean    8.500000   232.531915
std     4.658554   316.792200
min     1.000000     0.000000
25%     4.750000    13.500000
50%     8.500000    81.000000
75%    12.250000   251.500000
max    16.000000  1041.000000

Categorical columns and their unique values:

community:
['A' 'B' 'C']
Exercise
// TODO: Participants write a prompt to explain the results in plain language
Basic Plot
ChatGPT Prompt (copy/paste)
Persona:
You are an expert epidemiological modeler and Python educator.

Context:
- Dataset is already loaded into a DataFrame called `measles_df`
- Columns: biweek, community, measles

Task:
- Plot measles cases over time for each community
- Use one time-series plot
- Label axes and include a legend
- Briefly explain what biweekly case counts mean for epidemic modeling
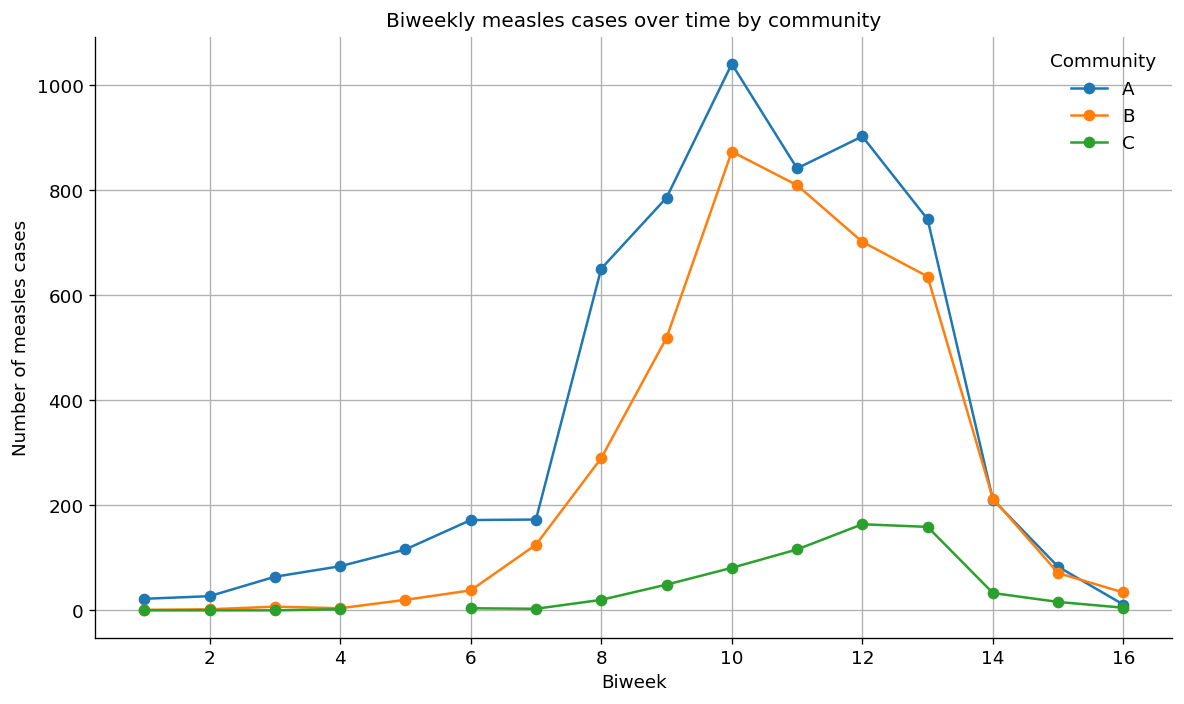
import matplotlib.pyplot as plt# Plot measles cases over time for each communityplt.figure(figsize=(10, 6))for community, df_group in measles_df.groupby("community"): plt.plot( df_group["biweek"], df_group["measles"], marker="o", label=community )# Labels and legendplt.xlabel("Biweek")plt.ylabel("Number of measles cases")plt.title("Biweekly measles cases over time by community")plt.legend(title="Community")plt.tight_layout()plt.show()
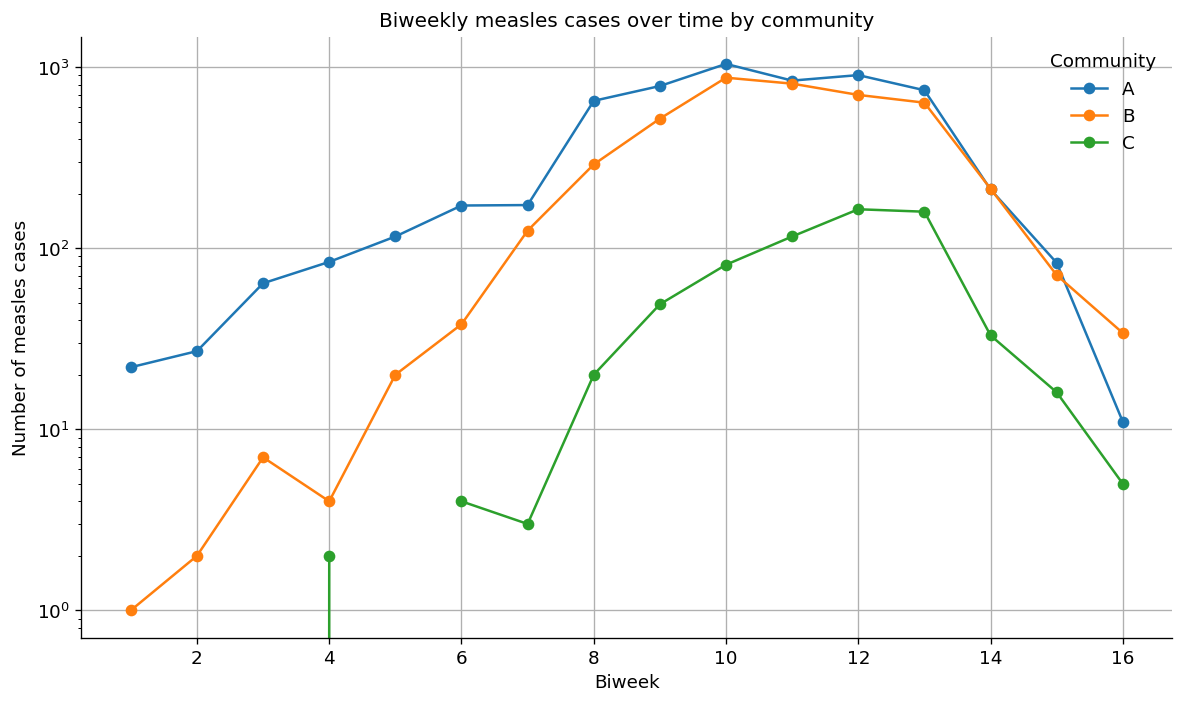
import matplotlib.pyplot as plt# Plot measles cases over time for each communityplt.figure(figsize=(10, 6))for community, df_group in measles_df.groupby("community"): plt.plot( df_group["biweek"], df_group["measles"], marker="o", label=community )plt.yscale("log")# Labels and legendplt.xlabel("Biweek")plt.ylabel("Number of measles cases")plt.title("Biweekly measles cases over time by community")plt.legend(title="Community")plt.tight_layout()plt.show()
2. Feature-Based Estimation: Early Growth (Quick R₀)
We estimate early exponential growth using a semi-log regression: - Choose an early window where cases grow roughly exponentially. - Fit log(cases) vs time.
ChatGPT Prompt (copy/paste)
## Persona

You are an **expert in infectious disease modeling**, with experience in early-outbreak analysis and interpretation of epidemic growth rates.

## Context

* **Disease:** Measles
* **Community:** A
* **Data:** Biweekly reported case counts
* **Epidemic phase:** Early outbreak (first ~8–10 biweeks), where case counts exhibit **exponential growth**
* **Dataset:** Already loaded as `measles_df`

### Dataset structure

`
<class 'pandas.core.frame.DataFrame'>
RangeIndex: 48 entries, 0 to 47
Columns:
- biweek     (int64)
- community  (object)
- measles    (float64, 47 non-null)
`

## Task

Estimate the **early exponential growth rate** of the outbreak by:

1. Selecting an appropriate **early biweek window** (≈ 8–10 biweeks)
2. Fitting a **log-linear model**: log(measles cases) vs. time
3. Producing a **semi-log plot** showing observed data and fitted exponential growth
4. Converting the estimated growth rate to an **approximate basic reproduction number (R₀)**, assuming:

   * Infectious removal rate: **γ = 1 per biweek**

## Constraints

* Use **NumPy** and **SciPy** only (Matplotlib for plotting is acceptable)
* Clearly **state and explain modeling assumptions**
* Print key **statistical results** (e.g., slope, confidence intervals if available, R₀)
* **Output code only** (do not execute)

## Verification / Expected Output

* A **semi-log plot** of measles cases with the fitted exponential curve
* Printed values for:

  * Estimated **growth rate (slope)**
  * Corresponding **R₀ estimate**
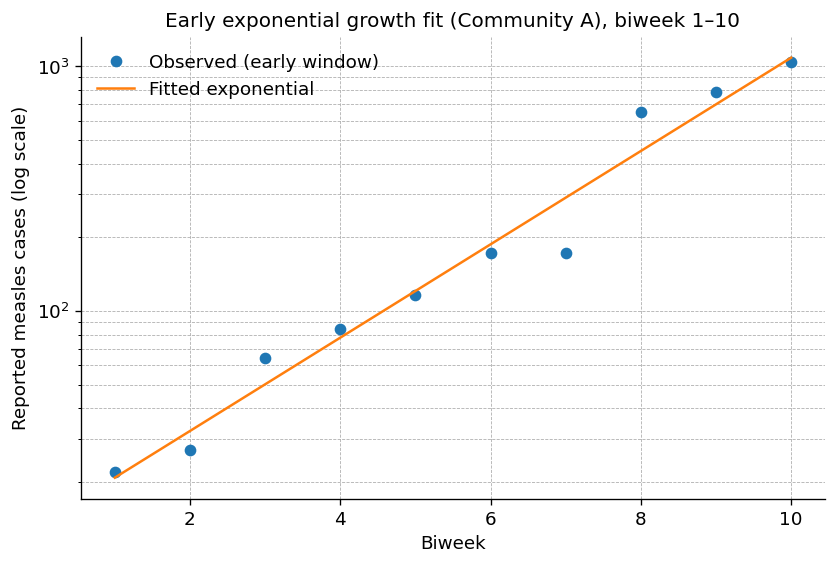
# Early exponential growth estimation for measles (Community A)# Constraints: NumPy + SciPy only (Matplotlib OK). Code-only, no execution.import numpy as npimport matplotlib.pyplot as pltfrom scipy import stats# -----------------------------# User-adjustable settings# -----------------------------COMMUNITY ="A"# Choose the early window length (in biweeks) OR explicit biweek range.# Option 1 (recommended): first N biweeks from the first nonzero caseEARLY_N_BIWEEKS =10# try 8–10START_AT_FIRST_POSITIVE =True# Option 2: explicit inclusive biweek indices (overrides Option 1 if not None)EARLY_BIWEEK_MIN =None# e.g., 0EARLY_BIWEEK_MAX =None# e.g., 9# Handling zeros / missingMIN_CASES =1.0# exclude cases < MIN_CASES (avoids log(0))ALPHA =0.05# 95% CI# R0 conversion assumptionGAMMA_PER_BIWEEK =1.0# infectious removal rate γ (per biweek)# -----------------------------# 1) Subset early window data# -----------------------------dfA = measles_df.loc[measles_df["community"] == COMMUNITY, ["biweek", "measles"]].copy()dfA = dfA.dropna(subset=["measles"])# Keep only positive (or >= MIN_CASES) counts for log fitdfA = dfA.loc[dfA["measles"] >= MIN_CASES].copy()dfA = dfA.sort_values("biweek")if dfA.empty:raiseValueError("No data points with measles >= MIN_CASES in the selected community/window.")# Determine early-window biweek boundsif (EARLY_BIWEEK_MIN isnotNone) and (EARLY_BIWEEK_MAX isnotNone): bw_min, bw_max =int(EARLY_BIWEEK_MIN), int(EARLY_BIWEEK_MAX)else:if START_AT_FIRST_POSITIVE: bw_min =int(dfA["biweek"].iloc[0])else: bw_min =int(dfA["biweek"].min()) bw_max = bw_min +int(EARLY_N_BIWEEKS) -1early = dfA.loc[(dfA["biweek"] >= bw_min) & (dfA["biweek"] <= bw_max)].copy()early = early.sort_values("biweek")if early.shape[0] <3:raiseValueError(f"Need at least 3 points to fit a log-linear model; got {early.shape[0]} "f"in window biweek [{bw_min}, {bw_max}]." )# Use time in "biweeks since window start" for interpretabilityt = (early["biweek"].to_numpy(dtype=float) -float(bw_min))y = early["measles"].to_numpy(dtype=float)logy = np.log(y)# -----------------------------# 2) Fit log-linear model: log(y) = a + r * t + error# r is the exponential growth rate per biweek# -----------------------------# stats.linregress uses ordinary least squares and returns slope, intercept, etc.fit = stats.linregress(t, logy)r_hat =float(fit.slope) # growth rate per biweeka_hat =float(fit.intercept) # log-scale interceptr_se =float(fit.stderr) # standard error of slope (if available)n = t.sizedf = n -2# 95% CI for slope using Student-ttcrit = stats.t.ppf(1- ALPHA /2, df)r_ci = (r_hat - tcrit * r_se, r_hat + tcrit * r_se)# -----------------------------# 3) Convert growth rate to approximate R0# Assumption: SIR-like early phase with S ~ 1, growth rate r ≈ β - γ,# so R0 = β/γ ≈ (r + γ)/γ = 1 + r/γ# -----------------------------gamma =float(GAMMA_PER_BIWEEK)R0_hat =1.0+ (r_hat / gamma)R0_ci = (1.0+ (r_ci[0] / gamma), 1.0+ (r_ci[1] / gamma))# -----------------------------# 4) Plot: semi-log (y on log-scale) with fitted exponential curve# -----------------------------# Smooth curve over the early windowt_grid = np.linspace(t.min(), t.max(), 200)y_fit = np.exp(a_hat + r_hat * t_grid)plt.figure(figsize=(8, 5))plt.semilogy(early["biweek"], y, "o", label="Observed (early window)")plt.semilogy(bw_min + t_grid, y_fit, "-", label="Fitted exponential")plt.title(f"Early exponential growth fit (Community {COMMUNITY}), biweek {bw_min}–{bw_max}")plt.xlabel("Biweek")plt.ylabel("Reported measles cases (log scale)")plt.grid(True, which="both", linestyle="--", linewidth=0.5)plt.legend()# -----------------------------# Print key results + assumptions# -----------------------------print("=== Early Exponential Growth (log-linear) ===")print(f"Community: {COMMUNITY}")print(f"Early window biweeks: [{bw_min}, {bw_max}]")print(f"Points used (after dropping NA and < {MIN_CASES}): n = {n}")print("")print("Model: log(cases_t) = a + r * t + error, where t is biweeks since window start")print(f"Estimated growth rate r (per biweek): {r_hat:.6f}")print(f"95% CI for r: [{r_ci[0]:.6f}, {r_ci[1]:.6f}]")print(f"R-squared: {fit.rvalue**2:.4f}")print(f"p-value (slope): {fit.pvalue:.3e}")print("")print("R0 approximation:")print("Assumption: early phase S≈1 and SIR-like growth r ≈ β - γ, so R0 = β/γ ≈ 1 + r/γ")print(f"Using γ = {gamma:.3f} per biweek")print(f"Estimated R0: {R0_hat:.4f}")print(f"95% CI for R0 (from slope CI): [{R0_ci[0]:.4f}, {R0_ci[1]:.4f}]")# If running in a notebook, show the plot:# plt.show()
=== Early Exponential Growth (log-linear) ===
Community: A
Early window biweeks: [1, 10]
Points used (after dropping NA and < 1.0): n = 10

Model: log(cases_t) = a + r * t + error, where t is biweeks since window start
Estimated growth rate r (per biweek): 0.439208
95% CI for r: [0.373936, 0.504481]
R-squared: 0.9678
p-value (slope): 2.963e-07

R0 approximation:
Assumption: early phase S≈1 and SIR-like growth r ≈ β - γ, so R0 = β/γ ≈ 1 + r/γ
Using γ = 1.000 per biweek
Estimated R0: 1.4392
95% CI for R0 (from slope CI): [1.3739, 1.5045]
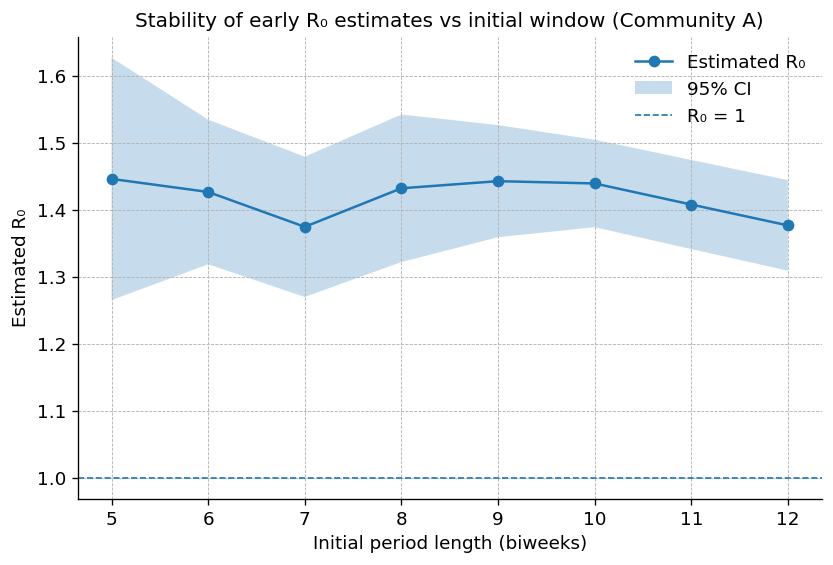
Goal Assess how sensitive the estimated basic reproduction number (R₀) is to the choice of early-outbreak window length.
Method (brief) For a sequence of increasing early-outbreak windows (measured in biweeks):
Fit a log-linear model to early reported measles cases to estimate the exponential growth rate.
Convert the growth rate to R₀ assuming a fixed infectious removal rate (γ = 1 per biweek).
Compute a 95% confidence interval for R₀ from the regression uncertainty.
Visualize R₀ and its uncertainty as a function of the window length.
Interpretation Stable R₀ estimates across window lengths suggest a robust early-growth signal, while strong variation indicates sensitivity to window choice or departures from exponential growth.
Continue with the this prompt
For a range of early-outbreak window lengths, plot the estimated R₀ (derived from exponential growth rates) together with its 95% confidence interval, as a function of the initial period length (in biweeks).
# Plot estimated R0 (with CI) versus initial-period length (number of biweeks)# Constraints respected: NumPy, SciPy, Matplotlib only. Code-only.import numpy as npimport matplotlib.pyplot as pltfrom scipy import stats# -----------------------------# User-adjustable settings# -----------------------------COMMUNITY ="A"MIN_CASES =1.0GAMMA_PER_BIWEEK =1.0# γALPHA =0.05# 95% CI# Range of early-window lengths to evaluate (in biweeks)WINDOW_LENGTHS = np.arange(5, 13) # e.g., 5–12 biweeks# -----------------------------# Prepare data# -----------------------------dfA = measles_df.loc[measles_df["community"] == COMMUNITY, ["biweek", "measles"]].copy()dfA = dfA.dropna(subset=["measles"])dfA = dfA.loc[dfA["measles"] >= MIN_CASES].copy()dfA = dfA.sort_values("biweek")if dfA.shape[0] < WINDOW_LENGTHS.max():raiseValueError("Not enough positive observations to cover the largest window length.")# Start window at first positive casebw_start =int(dfA["biweek"].iloc[0])# StorageR0_hat_list = []R0_lo_list = []R0_hi_list = []# -----------------------------# Loop over window lengths# -----------------------------for L in WINDOW_LENGTHS: bw_end = bw_start +int(L) -1 early = dfA.loc[(dfA["biweek"] >= bw_start) & (dfA["biweek"] <= bw_end)].copy() early = early.sort_values("biweek")if early.shape[0] <3: R0_hat_list.append(np.nan) R0_lo_list.append(np.nan) R0_hi_list.append(np.nan)continue t = (early["biweek"].to_numpy(dtype=float) -float(bw_start)) y = early["measles"].to_numpy(dtype=float) logy = np.log(y) fit = stats.linregress(t, logy) r_hat =float(fit.slope) r_se =float(fit.stderr) df = t.size -2 tcrit = stats.t.ppf(1- ALPHA /2, df) r_ci = (r_hat - tcrit * r_se, r_hat + tcrit * r_se)# R0 ≈ 1 + r / γ R0_hat =1.0+ r_hat / GAMMA_PER_BIWEEK R0_ci = (1.0+ r_ci[0] / GAMMA_PER_BIWEEK,1.0+ r_ci[1] / GAMMA_PER_BIWEEK) R0_hat_list.append(R0_hat) R0_lo_list.append(R0_ci[0]) R0_hi_list.append(R0_ci[1])R0_hat_arr = np.array(R0_hat_list)R0_lo_arr = np.array(R0_lo_list)R0_hi_arr = np.array(R0_hi_list)# -----------------------------# Plot R0 vs initial-period length# -----------------------------plt.figure(figsize=(8, 5))plt.plot(WINDOW_LENGTHS, R0_hat_arr, marker="o", label="Estimated R₀")plt.fill_between( WINDOW_LENGTHS, R0_lo_arr, R0_hi_arr, alpha=0.25, label="95% CI")plt.axhline(1.0, linestyle="--", linewidth=1, label="R₀ = 1")plt.xlabel("Initial period length (biweeks)")plt.ylabel("Estimated R₀")plt.title(f"Stability of early R₀ estimates vs initial window (Community {COMMUNITY})")plt.grid(True, linestyle="--", linewidth=0.5)plt.legend()# If running interactively:# plt.show()# -----------------------------# Print table of results# -----------------------------print("Initial window (biweeks) | R0_hat | R0_CI_low | R0_CI_high")for L, r0, lo, hi inzip(WINDOW_LENGTHS, R0_hat_arr, R0_lo_arr, R0_hi_arr):print(f"{L:>23d} | {r0:6.3f} | {lo:10.3f} | {hi:11.3f}")
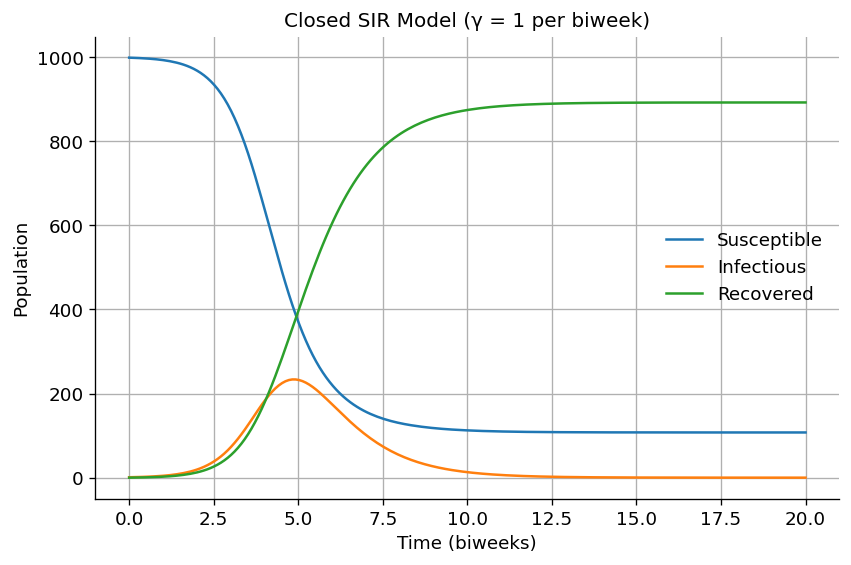
We use a closed SIR model for a single outbreak wave: - S(t): susceptible - I(t): infectious - R(t): recovered
Time unit = biweeks.
ChatGPT Prompt (copy/paste)
Persona:
You are an expert epidemiological modeler and Python educator.

Context:
- Closed SIR model (no birth or death)
- Time unit: biweeks
- Infectious period ≈ 2 weeks (gamma ≈ 1 per biweek)

Task:
Implement an SIR model using SciPy ODE solving:
- Define the SIR equations, the function name should be `sir_rhs`
- Solve over a biweekly time grid, put it in the function `simulate_sir`
- Plot S, I, R over time

Constraints:
- Use scipy.integrate.solve_ivp
- Keep code readable and commented

Verification:
- Plot S, I, R
- Verify S + I + R ≈ N
import numpy as npimport matplotlib.pyplot as pltfrom scipy.integrate import solve_ivpdef sir_rhs(t, y, beta, gamma, N):""" Right-hand side of the closed SIR model. Parameters ---------- t : float Time (in biweeks) y : array-like Current state vector [S, I, R] beta : float Transmission rate (per biweek) gamma : float Recovery rate (per biweek) N : float Total population size (constant) Returns ------- dydt : list Time derivatives [dS/dt, dI/dt, dR/dt] """ S, I, R = y dSdt =-beta * S * I / N dIdt = beta * S * I / N - gamma * I dRdt = gamma * Ireturn [dSdt, dIdt, dRdt]def simulate_sir( N=1000, I0=1, R0=0, beta=2.5, # example: R0_basic = beta / gamma = 2.5 gamma=1.0, # infectious period ≈ 1 biweek t_max=20):""" Simulate the SIR model over a biweekly time grid. Returns ------- t : array Time grid (biweeks) S, I, R : arrays Time series of compartments """# Initial susceptible population S0 = N - I0 - R0# Initial condition vector y0 = [S0, I0, R0]# Time grid (biweekly resolution) t_eval = np.linspace(0, t_max, 200)# Solve ODE system sol = solve_ivp( fun=lambda t, y: sir_rhs(t, y, beta, gamma, N), t_span=(0, t_max), y0=y0, t_eval=t_eval, vectorized=False ) S, I, R = sol.y t = sol.treturn t, S, I, R# =========================# Run simulation# =========================t, S, I, R = simulate_sir()# =========================# Verification: Mass balance# =========================N_total = S + I + Rprint("Maximum deviation from N:", np.max(np.abs(N_total - N_total[0])))# =========================# Plot results# =========================plt.figure()plt.plot(t, S, label="Susceptible")plt.plot(t, I, label="Infectious")plt.plot(t, R, label="Recovered")plt.xlabel("Time (biweeks)")plt.ylabel("Population")plt.title("Closed SIR Model (γ = 1 per biweek)")plt.legend()plt.show()
Maximum deviation from N: 2.2737367544323206e-13
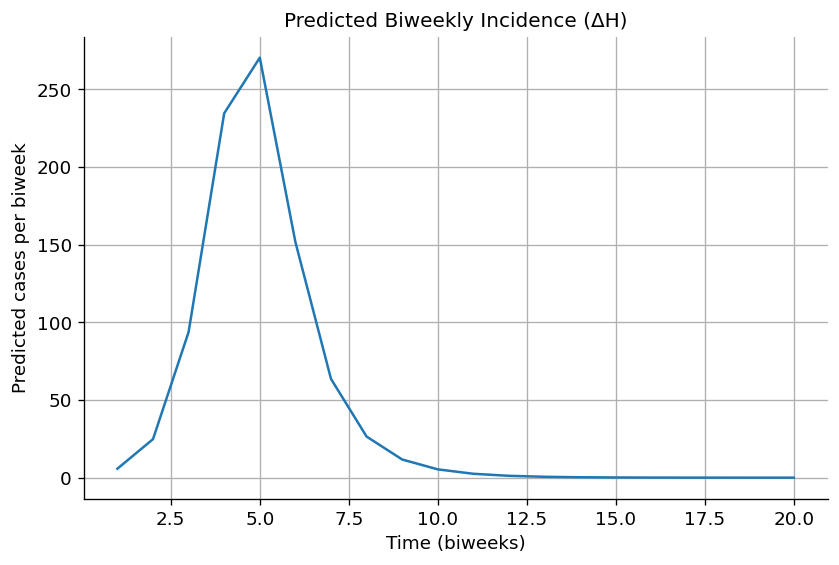
4. Map Model Output to Observations (Incidence via ΔH)
Observed data are biweekly case counts, not the state I(t).
We model incidence using an accumulator:
Add H(t) with dH/dt = β S I / N
Predicted biweekly counts ≈ ΔH over each biweek interval
ChatGPT Prompt
Persona:
You are an expert epidemic modeler.

Context:
- Observed data are biweekly case counts (incidence)
- SIR model outputs states

Task:
Extend the SIR model by:
- Adding H(t) with dH/dt = beta*S*I/N
- Computing predicted biweekly cases as ΔH aligned to biweeks

Constraints:
- Keep code minimal and readable

Verification:
- Plot predicted ΔH
import numpy as npimport matplotlib.pyplot as pltfrom scipy.integrate import solve_ivpdef sir_with_incidence_rhs(t, y, beta, gamma, N):""" SIR model with cumulative incidence H. y = [S, I, R, H] """ S, I, R, H = y infection_rate = beta * S * I / N dSdt =-infection_rate dIdt = infection_rate - gamma * I dRdt = gamma * I dHdt = infection_rate # cumulative infectionsreturn [dSdt, dIdt, dRdt, dHdt]def simulate_sir_with_incidence( N=1000, I0=1, R0=0, beta=2.5, gamma=1.0, t_max=20):""" Simulate SIR model and compute biweekly predicted cases. """ S0 = N - I0 - R0 H0 =0 y0 = [S0, I0, R0, H0]# Biweekly grid (matches reporting interval) t_eval = np.arange(0, t_max +1) sol = solve_ivp( fun=lambda t, y: sir_with_incidence_rhs(t, y, beta, gamma, N), t_span=(0, t_max), y0=y0, t_eval=t_eval ) S, I, R, H = sol.y t = sol.t# Predicted biweekly cases = change in cumulative infections delta_H = np.diff(H)return t, S, I, R, H, delta_H# ======================# Run simulation# ======================t, S, I, R, H, delta_H = simulate_sir_with_incidence()# ======================# Plot predicted biweekly incidence# ======================plt.figure()plt.plot(t[1:], delta_H)plt.xlabel("Time (biweeks)")plt.ylabel("Predicted cases per biweek")plt.title("Predicted Biweekly Incidence (ΔH)")plt.show()
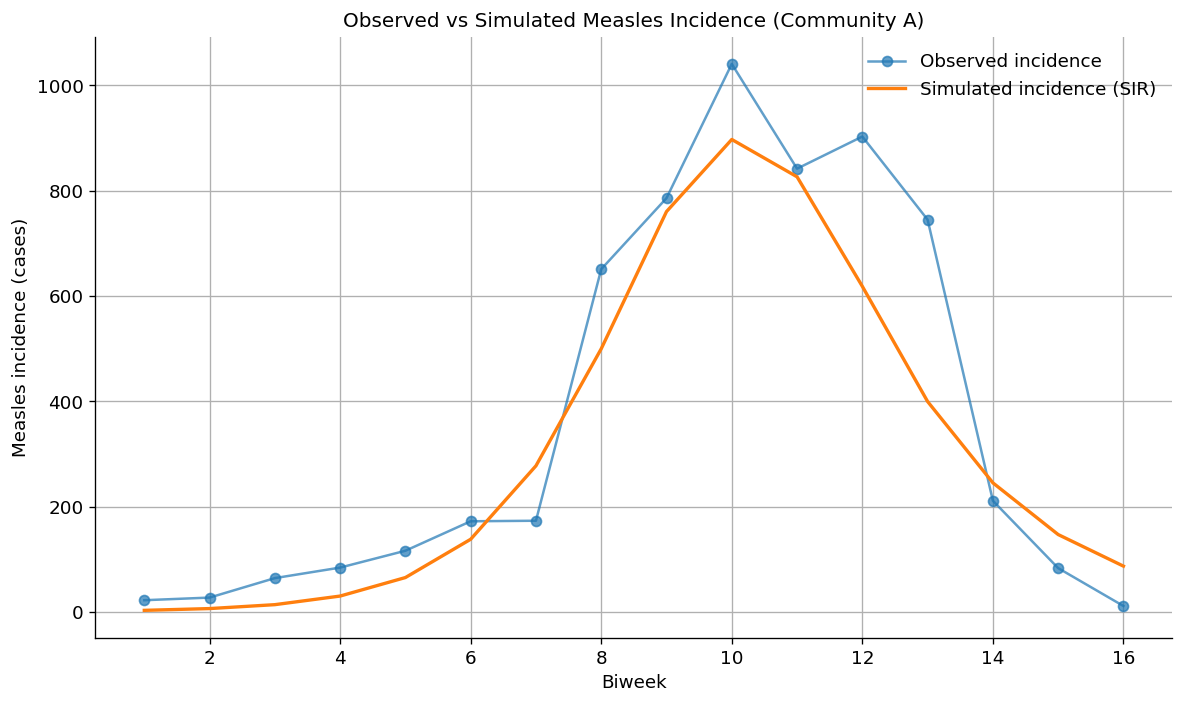
Continue with this prompt to plot the data
I have biweekly measles incidence data for Community A:

measles_df = pd.read_csv("data/niamey.csv")

dfA = (
    measles_df
    .loc[measles_df["community"] == "A", ["biweek", "measles"]]
    .dropna(subset=["measles"])
    .copy()
)


- dfA["biweek"] contains the biweekly time index

- dfA["measles"] contains observed biweekly incidence (number of cases)

I also have an SIR model that returns simulated incidence:

def simulate_sir_with_incidence(
    N=1000,
    I0=1,
    R0=0,
    beta=2.5,
    gamma=1.0,
    t_max=20
):
    ...
    return t, S, I, R, H, delta_H


Where:

t → model time points (in biweeks)

delta_H → simulated biweekly incidence (new infections per biweek)

H → cumulative infections

What I want to do

- Plot observed measles incidence (dfA["measles"])

- Overlay simulated biweekly incidence (delta_H) on the same figure

- Use t[1:] when plotting delta_H as len(t) is different from len(delta_h) by 1 unit
# ---------------------------------------# Get observed data for community A# ---------------------------------------measles_df = pd.read_csv("data/niamey.csv")dfA = measles_df.loc[ measles_df["community"] =="A", ["biweek", "measles"]].copy()dfA = dfA.dropna(subset=["measles"])# Run simulationt, S, I, R, H, delta_H = simulate_sir_with_incidence( N=7000, I0=1, R0=0, beta=1.8, gamma=1.0, t_max=dfA["biweek"].max())import matplotlib.pyplot as pltplt.figure(figsize=(10, 6))# Observed measles incidenceplt.plot( dfA["biweek"], dfA["measles"],'o-', label="Observed incidence", alpha=0.7)# Simulated incidenceplt.plot( t[1:], # shift because delta_H is one shorter delta_H,'-', label="Simulated incidence (SIR)", linewidth=2)plt.xlabel("Biweek")plt.ylabel("Measles incidence (cases)")plt.title("Observed vs Simulated Measles Incidence (Community A)")plt.legend()plt.grid(True)plt.tight_layout()plt.show()
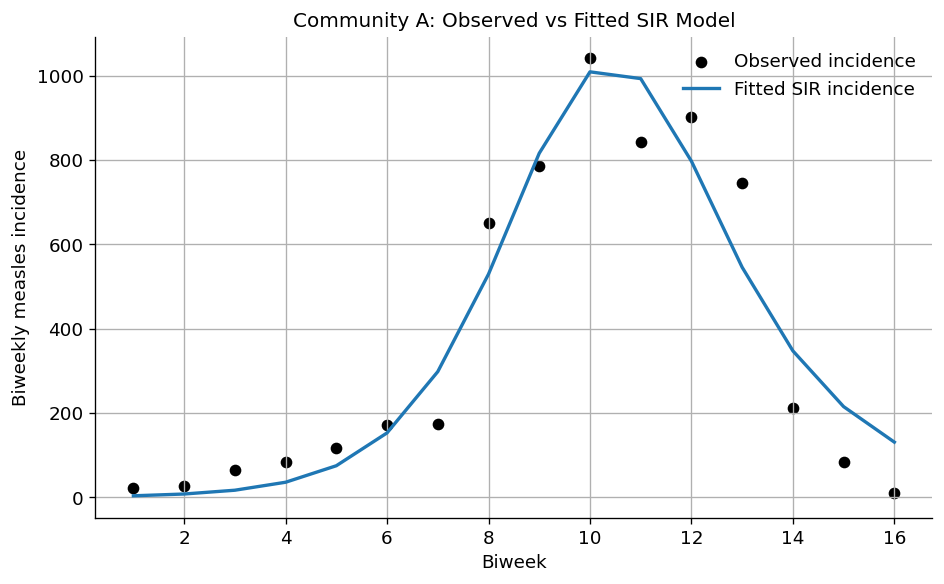
5. Fit Parameters by Least Squares
We fit parameters by minimizing squared error between observed counts and predicted ΔH.
ChatGPT Prompt (copy/paste)
## 👤 Persona

You are an **expert in numerical optimization for epidemic models**, with experience fitting compartmental models to incidence data using nonlinear least squares.

---

## 📂 Data

We have **biweekly measles incidence data** for **Community A**:

measles_df = pd.read_csv("data/niamey.csv")

dfA = (
    measles_df
    .loc[measles_df["community"] == "A", ["biweek", "measles"]]
    .dropna(subset=["measles"])
    .copy()
)

* `dfA["biweek"]` → biweekly time index
* `dfA["measles"]` → observed biweekly incidence (case counts)

---

## 🧪 Model

We use an SIR model that returns simulated incidence:

def simulate_sir_with_incidence(
    N=1000,
    I0=1,
    R0=0,
    beta=2.5,
    gamma=1.0,
    t_max=20
):
    ...
    return t, S, I, R, H, delta_H


Where:

* `t` → model time points (in biweeks)
* `delta_H` → simulated **biweekly incidence** (new infections per biweek)
* Use `t[1:]` to align with `delta_H` (since incidence is computed between time steps)

---

## 🎯 Objective

Fit model parameters to the observed incidence data using **nonlinear least squares**.

### Parameters to estimate:

* `N` (population size)
* `beta` (transmission rate)
* Optional: `I0` (initial infected)

### Fixed parameter:

* `gamma = 1.0`

---

## 📈 Initialization Strategy

Use an early-growth estimate:

* Estimated basic reproduction number:

  [
  R_0 = 1.443
  ]

* Since ( R_0 = \beta / \gamma ), initialize:

  [
  \beta_0 = 1.443
  ]

Choose reasonable initial guesses and bounds:

* `N` within plausible community size range
* `beta > 0`
* `I0 ≥ 1`

---

## ⚙️ Optimization Requirements

* Use `scipy.optimize.least_squares`
* Fit by minimizing:

[
\text{SSE} = \sum ( \text{Observed} - \text{Predicted} )^2
]

* Ensure runtime is suitable for a workshop (avoid heavy MCMC or expensive methods)

---

## 📊 Verification & Output

After fitting:

1. Overlay observed and fitted incidence curves
2. Print:

   * Best-fit parameter values
   * Sum of squared errors (SSE)

---

## 📌 Expected Deliverables

* Residual function definition
* Call to `least_squares`
* Overlay plot (observed vs fitted)
* Printed parameter estimates and SSE
* Clean, reproducible workshop-ready code
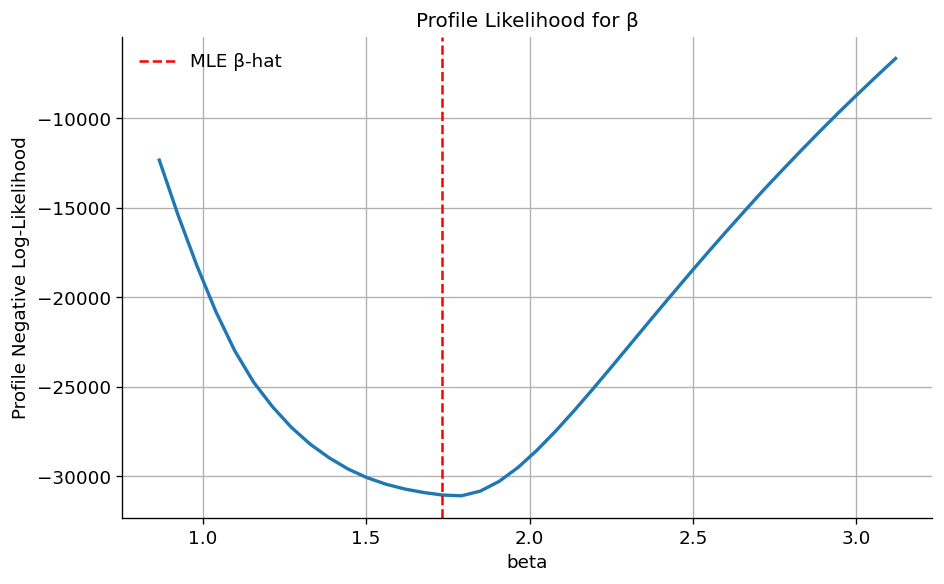
7. Quick Uncertainty: Profile Likelihood for β (Optional)
ChatGPT Prompt (copy/paste, continue with the likelihood chat)
Persona:
You are an expert in likelihood-based inference.

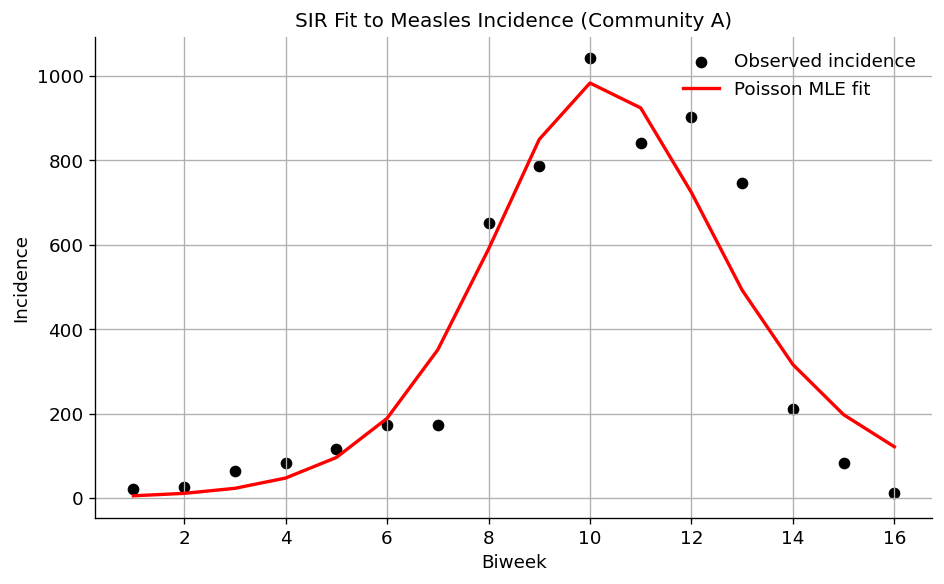
Context:
- We already have a Poisson likelihood fit
- We want uncertainty for beta

Task:
Create a profile likelihood for beta:
1) Fix beta over a grid
2) Optimize I0 and rho for each beta
3) Plot profile NLL(beta)

Constraints:
- Keep runtime reasonable for a workshop

Verification:
- Profile plot
- Explain how to interpret the uncertainty